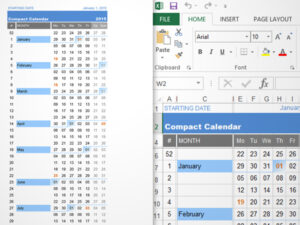
Use Excel as “Graph Paper” for Visualizing Schedules

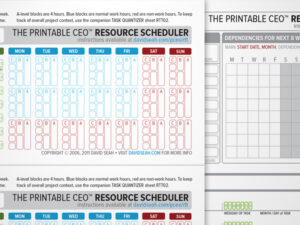
Gantt charts are a way to visualize how the multiple tasks of a project depend on each other. While you can find software that allows you to enter tasks and calculate schedules, I find them pretty cumbersome. Sometimes, I just want to sketch a Gantt chart out, and for that I use Excel like a piece of graph paper. I provide both a daily and weekly version of the spreadsheet.
While there is absolutely no automatic calculation at all, I find it a lot easier to keep up-to-date than fighting software like Microsoft Project. It’s great for establishing an initial gut-check version of a schedule before you start tracking time for real. Use this for simple projects that you can easily pass around. Use it to get your head around the tasks, resources, and dependencies before you enter data into a real project management system.
What this does do is generate dates, shade the weekends, and mark the months based on the input of a starting date. This version is also set up to print gridlines by default, which is helpful for making “gantt graph paper” to sketch on.
Instructions
There are instructions on its use on the first worksheet. There is an example worksheet included; check the document tabs at the bottom. If you are using a non-English version of Excel, please read the instructions on the Date Formatting Strings worksheet to fix the date formatting for your locale.
How do I remove the gray filled columns on weekends?
A common request is how to remove weekend color background. This is set using Conditional Formatting; here’s some screenshots showing where to click on Excel 2007.


How do I extend the date ranges to whatever I want?
If you’re not that familiar with Excel, you can watch this video, which describes how to change the date ranges and goes through the process of creating a chart from scratch
Enjoy!
Translations
Serbo-Croatian by Jovana Milutinovich of Webhostinggeeks.com.
Download
For notes on modifying this spreadsheet, see the instructions at the left. The video is also very helpful.
- Download dseah-gantt-excel-v5.zip.
Designed for Excel 2007 or higher. If you are using an earlier version of Excel, try downloading version 2, or see Microsoft’s update directions to add XLSX/XLTX file compatibility.
Again, this is not a real project management application, because it’s not capable of recalculating resource usage and shifting schedules. If you need to monitor a real project with shifting deadlines, you probably want to look at real project management software for your industry. This spreadsheet is good for simple scheduling and visualization.
Questions? Comments?
Go to the discussion page to leave your questions or comments! Thanks!
