(last edited on May 11, 2016 at 2:07 am)
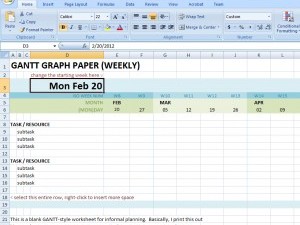
 A couple of requests came in for a weekly version of the Gantt
Excel spreadsheet. As it happens, I’d solved a similar problem a couple
months ago when making the spreadsheets for my Groundhog Day Resolutions
review day 3. So I dropped in the logic from those spreadsheets into
the Gantt Excel spreadsheet, et voila! It is done!
Like my other Excel Gantt chart, it automatically calculates the dates and formats everything according automatically for you. You just fill in the grid yourself manually, pretending Excel is a big sheet of magic graph paper. Try changing the year in the upper left corner, and watch the dates update automagically. When you’re done, print it out (turn on “grid lines” for a more structured look), pass around copies at your next meeting and enjoy the admiring glances from your peers for being so damn organized.
I imagine that these would be good for sketching-out multiple high-level, week-by-week project dependencies in a way that the Compact Calendar does not, as you can see overlapping threads of work more easily. Keep in mind, though, that the spreadsheet does not do project management software stuff like calculate dependencies, handle shifts in schedule, and all that stuff. This spreadsheet is a quick-and-dirty sketching tool only.
Visit the Manual Gantt Charting In Excel page to download the new files. The new zip archive is listed at the end of the post as a separate download. You’ll need Excel 2007 or newer to use the new spreadsheet.


9 Comments
I’ve been looking for a Gantt tool like this for a lot of my side projects. Can’t wait to try it out.
Thanks David.. Really enjoyed your stuff – love my ipad + digital tech, but as your site makes clear, there is a time and place, when a sheet of paper + a nice pen is the best planning toolset!…
Am using your weekly chart for cashflow forecasting my small law firm..
David, I have been trying out these weekly Gannt charts and really love them. I am starting to use them with a small team of people for multiple projects. One project has a 15 month timeline and it would be helpful to have it all on one chart. Right now I am just doing 4 months at a time. Your directions on the Gannt chart for how to extend the timeline are good and I think I can figure it out. I was just wondering if anyone had already done this. I am pretty new to Microsoft Excel :-(
Hi
This is a very useful tool, I have been using this and wondered if there was any way of applying conditional rules to the spreadsheet, I want a rule to highlight the font Red in the relevant columns (Date) if the date is within 120 days of today.
I can’t seem to do it.
Can you help?
Tom: Hopefully you figured out how to do it!
Ady: You should be able to write a formula that uses the Excel TODAY() function. Something like:
ABS(E6-TODAY())<120, where E6 contains the calculated date that is already in the spreadsheet. That will evaluate as TRUE 120 days before and afterwards.Thanks Dave, unfortunately I still can’t make it work. Appreciate you trying.
Ady: I had some trouble getting it to work until I saw that Excel was putting my formula in quotes.
=ABS(F$2-TODAY())<120as the formulaThat makes it work for my copy of Sample Gantt Daily.
Perfect, can’t thank you enough!
Regards
Ady
Hi Dave,
Great template, I have two questions:
How do adjust the formula to work monthly, instead of weekly? Using it for a 3 year roadmap.
Is it possible to put all the subtasks in one row (instead of multiple rows underneath).